


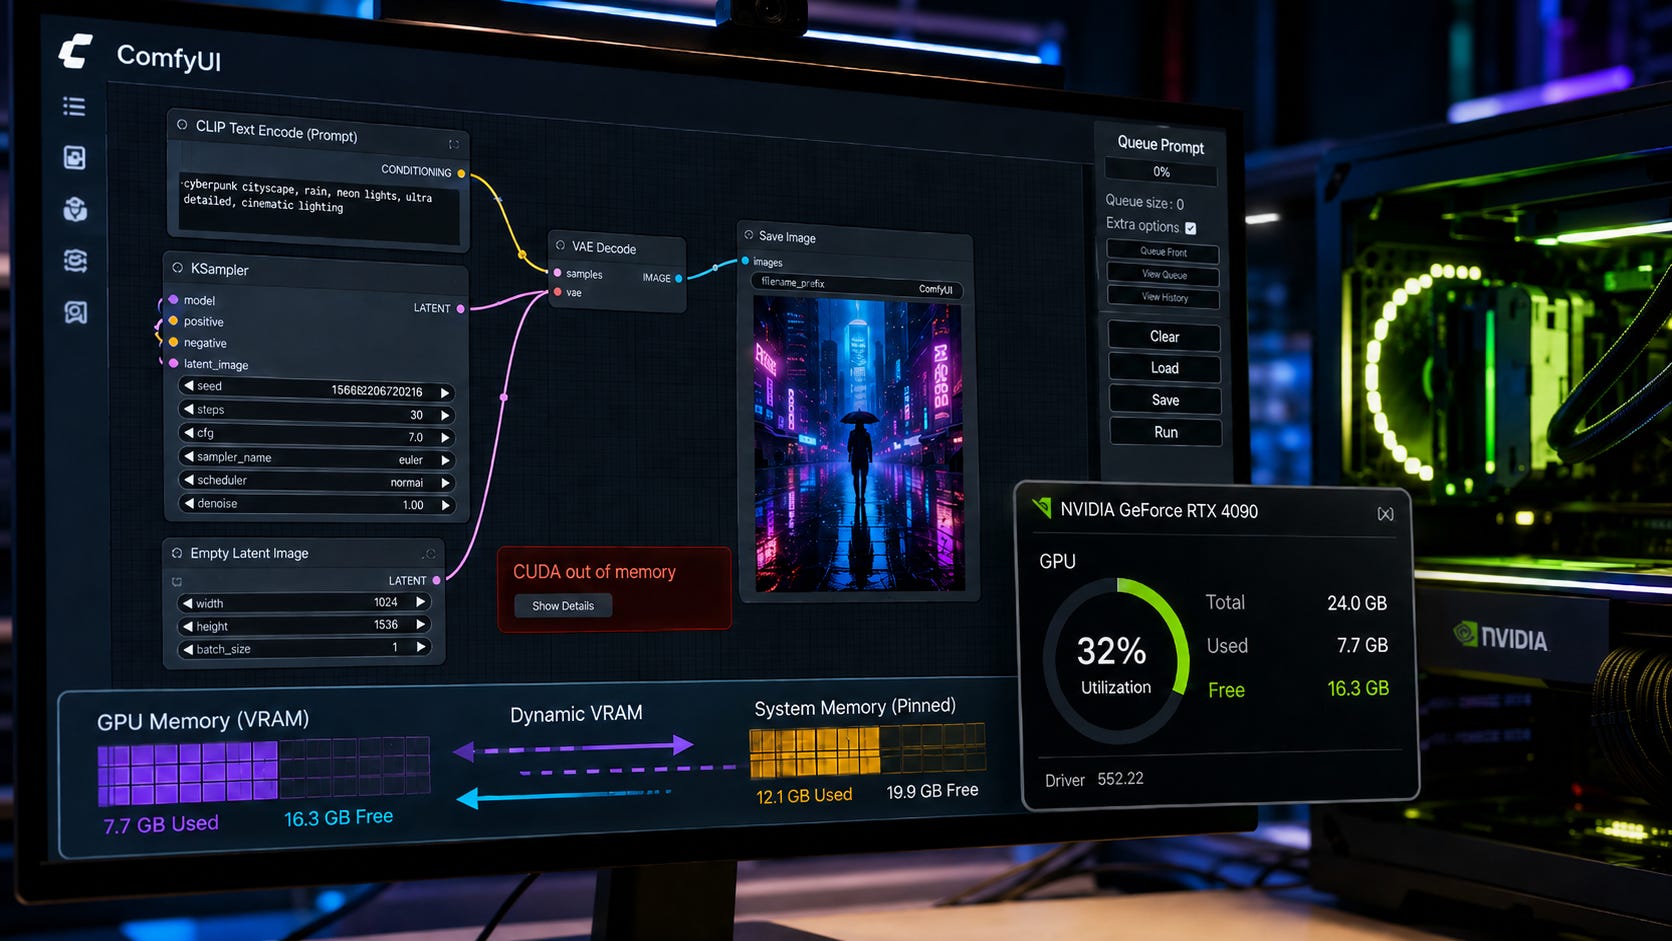
If ComfyUI says CUDA out of memory while your GPU monitor still shows plenty of free VRAM, do not start shopping for a bigger GPU yet.
The error can mean that you genuinely exceeded your card’s usable memory. It can also appear when something goes wrong in ComfyUI’s memory-management path, pinned host memory, CUDA, a custom node, or an update. ComfyUI’s newer Dynamic VRAM system adds another layer because model weights can move through physical VRAM and system memory using on-demand allocation instead of behaving like one static block.
The OOM error itself matters. What needs diagnosis is whether physical GPU capacity caused it.
That distinction can save you from spending money on a hardware upgrade that would never have fixed the failing workflow.
The safest approach is to reproduce the problem with the same workflow, watch memory while the failure happens, inspect the full trace, and change one memory-management variable at a time.
Quick fix for ComfyUI CUDA OOM with free VRAM
If the error appeared immediately after a ComfyUI update, especially if workflows that previously worked now fail regardless of model size, test the identical workflow with Dynamic VRAM disabled before reducing resolution or buying hardware.
Current ComfyUI still supports the --disable-dynamic-vram command-line option:
--disable-dynamic-vramThe option switches ComfyUI back to its estimate-based model-loading behavior. That makes it useful as a diagnostic even if you do not intend to leave Dynamic VRAM disabled permanently.
There is an important August 2026 exception. If your trace includes HostBuffer.read_file_slice failed, especially on a multi-GPU NVIDIA system, ComfyUI’s current moderator guidance identifies the problem as a CUDA error reported to NVIDIA. The recommended workaround for the affected configuration is to restrict ComfyUI to one GPU with --cuda-device 0, or use --disable-pinned-memory when multi-GPU operation is required.
That distinction matters. A workflow failing because of this CUDA or pinned-memory path should not immediately be treated as evidence that your GPU lacks enough VRAM.
What CUDA out of memory actually means in ComfyUI
A genuine GPU-memory shortage is straightforward. Your workflow requests another allocation, there is not enough usable VRAM available, and CUDA refuses the request.
The complication is that modern ComfyUI has more memory-management machinery between the workflow and the GPU than that simple description suggests.
ComfyUI introduced Dynamic VRAM in stable builds for NVIDIA hardware earlier in 2026. Instead of trying to predict all memory requirements for a model in advance, Dynamic VRAM uses a custom allocation and offloading system that can fault model weights into physical VRAM when needed. Lower-priority weights can be evicted as memory pressure changes.
ComfyUI says the system is designed to reduce system RAM pressure, avoid paging, improve VRAM utilization, and make larger models easier to run on constrained hardware. Under Dynamic VRAM, the amount of memory visible at one point in a workflow therefore does not tell you everything about what will be requested at the next point.


This architecture creates several paths that can eventually surface as an OOM-looking error. A workflow can genuinely exhaust available GPU memory. The Dynamic VRAM or offloading path can fail. Pinned host-memory transfers can become part of the failure. CUDA can enter a bad state. A custom node can allocate memory in a way ComfyUI does not expect. Another application can consume enough VRAM to push an otherwise viable workflow over the edge.
Even a legitimate free-VRAM reading can be misleading if you checked it at the wrong moment.
A card might show 14GB free before you press Queue, then consume most of that memory while loading models or executing the graph. That is why CUDA out of memory should begin the diagnosis rather than end it.
Diagnose the cause before changing the workflow
Use the same workflow for every controlled test. If you change the model, resolution, sampler, precision, nodes, CUDA settings, and memory flags at the same time, a successful run tells you very little about what actually fixed the problem.
Reproduce the error while watching VRAM. On an NVIDIA system, keep
nvidia-smirunning while the workflow executes. A convenient live view is:
nvidia-smi -l 1Pay attention to GPU memory around the failing operation. The idle value before generation starts is much weaker evidence than the memory state immediately before the crash.
Write down what changed. Record your ComfyUI version, GPU, driver, operating system, whether more than one GPU is visible, and whether the problem began after a ComfyUI, PyTorch, CUDA, driver, or custom-node update. A failure that starts immediately after an environment change deserves a different investigation from a workflow that has always exceeded your hardware.
Try a known simple workflow. ComfyUI’s troubleshooting guidance recommends testing a default workflow and disabling custom nodes while isolating a problem. If an official simple workflow succeeds while a larger custom graph fails, that evidence points away from a universal failure of ComfyUI’s memory manager.
Read the stack trace above the final OOM line. References to
comfy_aimdo,HostBuffer.read_file_slice,handle_pin, pinned memory, or model-management code give you a different lead from a straightforward allocation failure after VRAM steadily filled. The most useful error is often several lines aboveCUDA out of memory.A/B test the memory subsystem. Run the exact same workflow under the normal configuration, then change one relevant memory feature and run it again. If the workflow suddenly succeeds while everything else remains fixed, you have stronger evidence that raw GPU capacity was not the entire explanation.
Only then reduce the workload. If lowering resolution, reducing frame count, shrinking the batch, or using lower-precision weights consistently moves the failure threshold upward, while GPU memory is genuinely near its ceiling when the crash occurs, the evidence starts to look much more like a real capacity limit.
The most important principle is simple: free VRAM before generation is weak evidence.
You need to know what memory usage does while ComfyUI is performing the operation that actually fails.
Fix the August 2026 HostBuffer.read_file_slice CUDA OOM
The August 3 report that makes this error especially confusing is ComfyUI issue #15255.
The reporter was running ComfyUI 0.30.1 on Windows with an RTX 5060 Ti 16GB as the primary GPU and an RTX 3060 12GB as a second GPU. After updating that day, generations began failing almost immediately with:
CUDA error: out of memory
...
HostBuffer.read_file_slice failed
According to the report, the RTX 5060 Ti had more than 14GB free before generation. Small and large workflows failed similarly, custom nodes had already been ruled out, and launching ComfyUI with --disable-dynamic-vram restored successful generation.
At first glance, that looks like a straightforward Dynamic VRAM regression.
The later investigation changes how the failure should be diagnosed. The moderator note on the issue says the problem is a CUDA error that was reported to NVIDIA. For the affected multi-GPU setup, the current workaround is to restrict ComfyUI to a single GPU:
--cuda-device 0If you need multi-GPU operation, the documented workaround in that issue is:
--disable-pinned-memoryAs of August 20, 2026, the GitHub issue was still open. A proposed pull request intended to make ComfyUI respect the selected CUDA device for the multi-GPU failure also remained open, so it should not be treated as a released fix.
The practical lesson is that the text CUDA out of memory does not establish that GPU capacity caused this specific crash. The surrounding trace and system configuration matter.
If you have more than one NVIDIA GPU
Start by restricting ComfyUI to the GPU you actually want it to use:
python main.py --cuda-device 0Use the device number that corresponds to your intended GPU. Current ComfyUI’s command-line parser allows --cuda-device to select a single device or a comma-separated device list such as 0 or 0,1.
If single-GPU operation fixes the crash, that result tells you something important. A larger GPU would not have addressed the configuration path responsible for this particular failure.
If you need both GPUs visible, test pinned memory separately:
python main.py --disable-pinned-memoryRun the same workflow. If it succeeds, remove the argument, restart ComfyUI, and test again if you want to establish that the change is causal rather than coincidental.
Do not combine this immediately with several other memory flags. The goal is to isolate the failing subsystem, not to collect a permanent stack of startup arguments.
If you have one GPU but the trace looks the same
The August issue also includes discussion around single-GPU behavior, so a HostBuffer.read_file_slice failed trace should not be dismissed simply because your machine only has one active GPU.
Test --disable-pinned-memory, then test Dynamic VRAM separately.
Change only one flag between runs.
If pinned memory off fixes the failure, you have isolated one useful variable. If --disable-dynamic-vram fixes it instead, you have a different lead. If neither changes anything, continue outward to custom nodes, caching, smart memory, workload size, and the rest of the environment.
The objective is to identify the smallest configuration change that reliably makes the original workflow run.
Fix a Dynamic VRAM-specific OOM
If the failing workflow succeeds with:
python main.py --disable-dynamic-vramand fails again after you remove that flag, you have strong evidence that the identical workload and physical GPU can operate under ComfyUI’s older estimate-based model-loading behavior.
That does not prove your workflow has unlimited memory headroom. It does show that raw VRAM capacity by itself does not fully explain why one memory-management mode fails and another succeeds.
An earlier April 28 Dynamic VRAM issue on Linux described a 16GB RTX 5070 Ti hitting OOM with Dynamic VRAM enabled while a larger Wan 2.2 workflow succeeded after switching to the older allocator with --disable-dynamic-vram.
That older issue is now closed, but its closure does not prove that every later OOM with similar symptoms shares the same cause or has already been fixed.
The useful diagnostic rule is narrower: if Dynamic VRAM off makes the identical workload succeed, VRAM capacity alone is insufficient to explain the difference between the two runs.
For ComfyUI Desktop users, add the diagnostic flag through the installation’s startup-argument controls when your build exposes them. The current Comfy-Desktop source includes an editable launchArgs startup-arguments field that requires a restart after changes.
If your build does not expose the setting cleanly, launching the backend directly can be a cleaner diagnostic than changing unrelated configuration files.
Avoid reviving the old --normalvram argument while troubleshooting. It is no longer present as a valid current ComfyUI argument, and Popular AI has a separate guide for fixing the ComfyUI Desktop --normalvram startup crash if an older configuration is still injecting it.
More on ComfyUI troubleshooting:

Rule out custom nodes, pinned memory, smart memory, and caching
If disabling Dynamic VRAM changes nothing, widen the investigation.
Custom nodes should be near the top of that process. ComfyUI says many reported problems are ultimately related to custom nodes, and its official troubleshooting guidance recommends reproducing a failure with a default workflow and custom nodes disabled before assuming that ComfyUI core is responsible.
Current ComfyUI supports disabling all custom nodes from the command line:
--disable-all-custom-nodesRun the same workflow or the closest possible official equivalent after disabling them. If the OOM disappears, re-enable custom nodes gradually until the failure returns. That gives you a much stronger diagnosis than concluding that your GPU suddenly needs more memory.
Pinned memory deserves special attention with large video workloads. A recent ComfyUI pinned-memory discussion describes improved stability after disabling pinned memory, particularly where system RAM pressure and host-side model transfers are involved. The August HostBuffer.read_file_slice investigation separately names --disable-pinned-memory as a workaround for multi-GPU operation.
ComfyUI also exposes --disable-smart-memory, --reserve-vram, and caching controls such as --cache-none. The official troubleshooting documentation lists those as memory-management options.
Do not turn all of them on or off together.
A workflow that starts working after five simultaneous configuration changes may be usable again, but you still will not know which change mattered. That makes the next update or regression much harder to diagnose.
Controlled testing is slower than random flag switching for the first few runs. It is usually much faster by the end of the investigation.
How to recognize a real GPU-memory limit
A genuine VRAM limit usually behaves more predictably than a memory-management regression.
As the workflow approaches the failing operation, GPU memory usage moves toward the card’s usable ceiling. Increasing memory demand makes the failure easier to reproduce. Reducing memory demand moves the threshold in the opposite direction.
Larger images can increase memory pressure. More video frames can do the same. Bigger batches, heavier models, additional ControlNets, multiple loaded models, or higher-precision weights can all change the amount of memory required by a workflow.
When reducing one of those demands consistently makes an otherwise identical graph run again, the case for a genuine capacity limit becomes stronger.
For image generation, try reducing resolution or batch size while keeping the rest of the workflow unchanged.
For video, reduce resolution or frame count.
If the model has an appropriate lower-precision version for your workflow, test that version deliberately rather than changing several other variables at the same time.
Close browsers with GPU-heavy pages, games, video editors, other inference servers, and anything else occupying GPU memory. Then rerun the same graph and watch the actual memory usage.
What you want to find is a repeatable threshold.
If a workflow reliably fails when its memory demand exceeds the card’s available capacity and reliably succeeds after a controlled reduction, then considering more VRAM becomes reasonable.
Until you have that evidence, a GPU purchase is an expensive troubleshooting experiment.
Why idle VRAM can fool you
The phrase “I have free VRAM” can describe several different measurements.
You might be looking at VRAM before the model loads. You might be looking at Task Manager rather than the memory reading relevant to the failing CUDA allocation. Another process might acquire memory during generation. ComfyUI may also move through different loading, sampling, offloading, and decoding stages with very different requirements.
Dynamic VRAM makes the idle snapshot even less useful as a complete explanation because model weights can be allocated on demand.


The important comparison is therefore between the moment of failure and the amount of usable GPU memory available at that moment.
If memory rises steadily to the limit and the next allocation fails, that supports a normal capacity diagnosis.
If the workflow fails almost immediately while substantial memory appears available, all model sizes fail similarly, and changing a particular memory-management flag makes the exact workflow succeed, the evidence points somewhere else.
The error text alone cannot tell you which pattern you have.
Confirm that the fix is real
Before declaring the problem solved, run enough controlled tests to separate a reproducible fix from a lucky run.
Run the previously failing workflow at least twice with the suspected fix.
Run a simple known-good workflow as a control.
Restart ComfyUI and confirm that the fix survives a clean launch.
Remove the diagnostic flag once and verify whether the original failure returns if you are trying to establish causality.
If disabling Dynamic VRAM is consistently the difference between failure and success, record your ComfyUI version, PyTorch version, GPU, driver, operating system, workflow, and full console trace.
ComfyUI’s Dynamic VRAM guidance specifically asks users reporting problems to include full logs, the workflow, hardware, and operating system.
That information makes the result useful beyond your own machine and gives you a precise environment to retest after future updates.
What to collect if ComfyUI still fails
If you have ruled out Dynamic VRAM, pinned memory, multi-GPU selection, and custom nodes, stop focusing on the final CUDA out of memory line and collect the full failure context.
Record the workflow JSON, GPU model and VRAM, system RAM, ComfyUI version, PyTorch version, CUDA build, GPU driver, operating system, startup arguments, whether the failure began after an update, and the result of running a known default workflow.
ComfyUI’s troubleshooting documentation similarly asks for system information, GPU and driver details, full error text, reproduction steps, workflow files, and recent changes when reporting problems.
Search the current ComfyUI issue tracker using the first unusual line above the final CUDA exception.
HostBuffer.read_file_slice failed is far more specific than CUDA out of memory. The latter can describe a large number of unrelated failures, while the former can lead you toward the particular code path or regression that produced the exception.
The same principle applies to other traces. Search the unusual function, node, module, or operation nearest the beginning of the failure rather than treating the last line as the entire diagnosis.
Also be careful with old tutorials that recommend VRAM arguments without checking whether those arguments still exist. ComfyUI’s memory-management system changed substantially in 2026, so advice written for older builds can create a second problem while you are trying to solve the first.
Prevent the same ComfyUI OOM problem from returning
Keep a record of the ComfyUI version that runs your important workflows successfully.
Updates are easier to diagnose when you know exactly what changed. Updating ComfyUI core, every custom node, PyTorch, and the GPU driver at once can leave you with several plausible causes if a previously stable workflow fails afterward.
If an update breaks a stable setup, the timing of the change becomes useful evidence. Popular AI’s guide to why ComfyUI updates break workflows and how to fix them covers how core updates, custom-node version skew, and other moving parts can affect an existing graph.
For important production workflows, save the workflow JSON and record the environment that ran it successfully. Keep the ComfyUI version, relevant custom-node versions, major runtime versions, GPU driver, and any unusual startup flags with the workflow documentation.
That gives you a reproducible baseline.
“It worked last week” does not tell you what changed. A recorded working environment does.
More on ComfyUI troubleshooting:

Privacy, security, and account risk when sharing OOM logs
ComfyUI itself runs locally, but troubleshooting information can still expose details about your machine.
Console logs may contain usernames, absolute file paths, model locations, filenames, custom-node names, network addresses, or other environment details. Workflow JSON files can reveal prompts, model choices, local paths, and configuration details.
Review logs and workflows before posting them publicly.
Remove credentials, private paths you do not want exposed, and any sensitive prompt or workflow data. Never publish API tokens, access keys, passwords, or credentials used by custom nodes.
A complete bug report should contain enough technical information to reproduce the issue without exposing secrets that have nothing to do with the failure.
FAQ
Why does nvidia-smi show free VRAM when ComfyUI says CUDA out of memory?
Because the VRAM reading and the failing allocation may come from different moments or different parts of the memory-management path.
If you checked VRAM before starting generation, ComfyUI can still consume the remaining memory during model loading or inference. In other cases, a Dynamic VRAM, pinned-memory, CUDA, or custom-node failure can produce an OOM-looking exception without proving that physical GPU capacity caused the crash.
Watch memory during the actual failure, inspect the preceding stack trace, and A/B test the relevant memory-management path.
Should I disable Dynamic VRAM permanently?
Not automatically.
ComfyUI designed Dynamic VRAM to improve model offloading and memory use, and many workflows can benefit from it. Disabling it temporarily is more useful as a diagnostic first.
If the same workflow repeatedly succeeds only with Dynamic VRAM disabled, keeping the flag in place can be reasonable while you monitor the relevant issue or wait for a change. Record your versions so you can retest later instead of assuming the workaround must remain forever.
Does --lowvram fix these CUDA errors?
Only when the underlying problem is actually compatible with what
--lowvramchanges.Current ComfyUI’s argument description explicitly says
--lowvramdoes nothing while Dynamic VRAM is enabled. When Dynamic VRAM is not being used, the option makes the text encoders run on the CPU.That makes
--lowvrama poor generic response to every CUDA exception. Diagnose the failure path first.
Does 16GB of VRAM mean I need a 24GB GPU for ComfyUI?
No.
Some workflows genuinely require more than 16GB. Others fit comfortably within it. Model size, precision, resolution, frame count, batch size, auxiliary models, and ComfyUI’s offloading behavior all affect the requirement.
If controlled testing shows that VRAM capacity really is the limiting factor, Popular AI’s RTX 3090 ComfyUI guide covers the 24GB upgrade path.
A single OOM produced by a software or memory-management failure is not enough evidence to justify the purchase.
More on hardware for ComfyUI:

How to tell when more VRAM is actually the answer
When ComfyUI reports CUDA out of memory while VRAM appears free, start by proving what kind of OOM you have.
Watch VRAM during the operation that fails rather than relying on the idle reading. Check whether the problem began after an update. Read the lines above the final CUDA exception. Test a known workflow without custom nodes and keep every comparison controlled.
If the trace contains the current HostBuffer.read_file_slice failed failure, try the documented --cuda-device 0 or --disable-pinned-memory workaround that matches your configuration. Then test --disable-dynamic-vram separately.
If one memory-management change makes the identical workload succeed consistently, investigate that path before sacrificing image quality, shrinking models, or replacing the GPU.
If none of those tests changes the result and the workflow predictably runs out of usable VRAM as resolution, frames, batch size, model size, or precision increase, then reducing the workload is the appropriate next move. A repeatable memory ceiling is the evidence you want before considering a card with more VRAM.
A 24GB or 32GB GPU can solve a genuine capacity limit.
It cannot solve every error that happens to end with CUDA out of memory.
Explore more from Popular AI:
Start here | Local AI | Builds & gear | Autonomy & policy | Fixes & guides | Popular AI podcast
Have you hit a ComfyUI CUDA out of memory error while VRAM still looked free? What GPU and workflow were you running when it happened?